Reports
The reports feature allows you to display and update custom output in the UI during task execution.
First, you set the report=True flag in the task decorator. This enables the reporting feature for that task.
Within a task with reporting enabled, a
flyte.report.Report object is created automatically.
A Report object contains one or more tabs, each of which contains HTML.
You can write HTML to an existing tab and create new tabs to organize your content.
Initially, the Report object has one tab (the default tab) with no content.
To write content:
-
flyte.report.log()appends HTML content directly to the default tab. -
flyte.report.replace()replaces the content of the default tab with new HTML.
To get or create a new tab:
-
flyte.report.get_tab()allows you to specify a unique name for the tab, and it will return the existing tab if it already exists or create a new one if it doesn’t. It returns aflyte.report._report.Tab
You can log() or replace() HTML on the Tab object just as you can directly on the Report object.
Finally, you send the report to the Flyte server and make it visible in the UI:
-
flyte.report.flush()dispatches the report. It is important to call this method to ensure that the data is sent.
A simple example
# /// script
# requires-python = "==3.13"
# dependencies = [
#    "flyte>=2.0.0b52",
# ]
# main = "main"
# params = ""
# ///

import flyte
import flyte.report

env = flyte.TaskEnvironment(name="reports_example")


@env.task(report=True)
async def task1():
    await flyte.report.replace.aio("<p>The quick, brown fox jumps over a lazy dog.</p>")
    tab2 = flyte.report.get_tab("Tab 2")
    tab2.log("<p>The quick, brown dog jumps over a lazy fox.</p>")
    await flyte.report.flush.aio()


if __name__ == "__main__":
    flyte.init_from_config()
    r = flyte.run(task1)
    print(r.name)
    print(r.url)
    r.wait()
Here we define a task task1 that logs some HTML content to the default tab and creates a new tab named “Tab 2” where it logs additional HTML content.
The flush method is called to send the report to the backend.
A more complex example
Here is another example. We import the necessary modules, set up the task environment, define the main task with reporting enabled and define the data generation function:
import json
import random
import flyte
import flyte.report
env = flyte.TaskEnvironment(
name="globe_visualization",
)
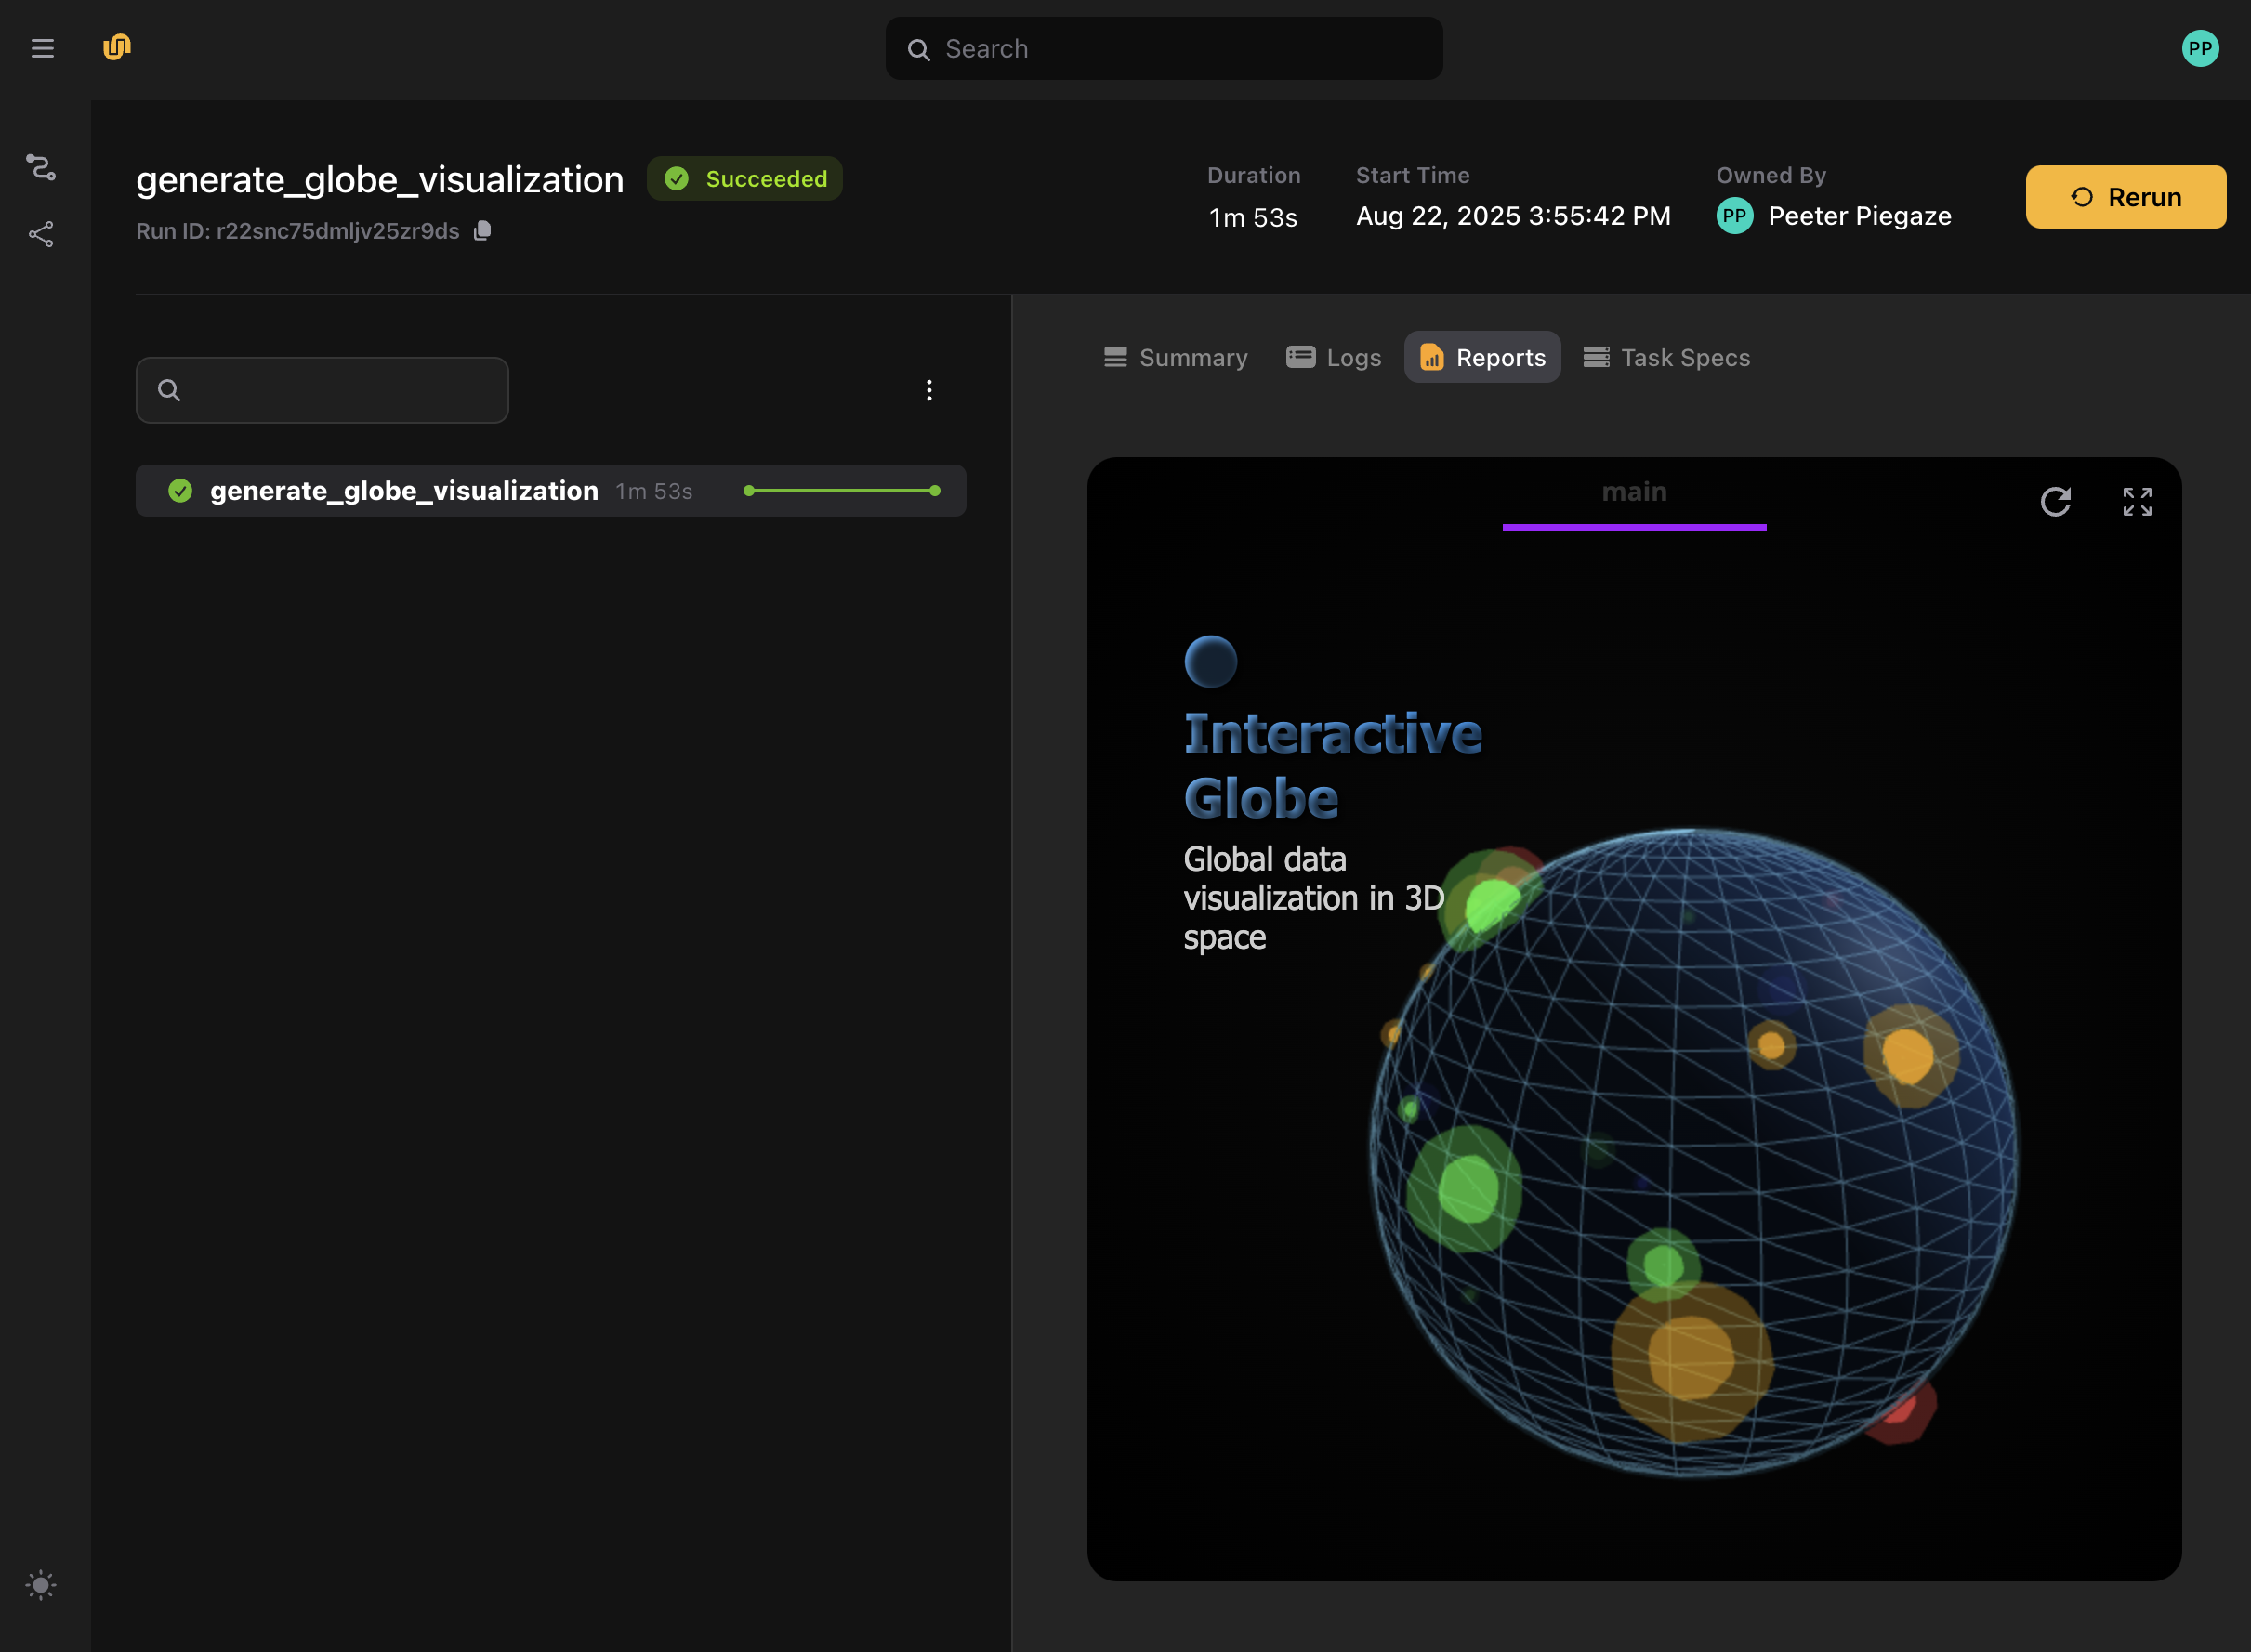
@env.task(report=True)
async def generate_globe_visualization():
await flyte.report.replace.aio(get_html_content())
await flyte.report.flush.aio()
def generate_globe_data():
"""Generate sample data points for the globe"""
cities = [
{"city": "New York", "country": "USA", "lat": 40.7128, "lng": -74.0060},
{"city": "London", "country": "UK", "lat": 51.5074, "lng": -0.1278},
{"city": "Tokyo", "country": "Japan", "lat": 35.6762, "lng": 139.6503},
{"city": "Sydney", "country": "Australia", "lat": -33.8688, "lng": 151.2093},
{"city": "Paris", "country": "France", "lat": 48.8566, "lng": 2.3522},
{"city": "São Paulo", "country": "Brazil", "lat": -23.5505, "lng": -46.6333},
{"city": "Mumbai", "country": "India", "lat": 19.0760, "lng": 72.8777},
{"city": "Cairo", "country": "Egypt", "lat": 30.0444, "lng": 31.2357},
{"city": "Moscow", "country": "Russia", "lat": 55.7558, "lng": 37.6176},
{"city": "Beijing", "country": "China", "lat": 39.9042, "lng": 116.4074},
{"city": "Lagos", "country": "Nigeria", "lat": 6.5244, "lng": 3.3792},
{"city": "Mexico City", "country": "Mexico", "lat": 19.4326, "lng": -99.1332},
{"city": "Bangkok", "country": "Thailand", "lat": 13.7563, "lng": 100.5018},
{"city": "Istanbul", "country": "Turkey", "lat": 41.0082, "lng": 28.9784},
{"city": "Buenos Aires", "country": "Argentina", "lat": -34.6118, "lng": -58.3960},
{"city": "Cape Town", "country": "South Africa", "lat": -33.9249, "lng": 18.4241},
{"city": "Dubai", "country": "UAE", "lat": 25.2048, "lng": 55.2708},
{"city": "Singapore", "country": "Singapore", "lat": 1.3521, "lng": 103.8198},
{"city": "Stockholm", "country": "Sweden", "lat": 59.3293, "lng": 18.0686},
{"city": "Vancouver", "country": "Canada", "lat": 49.2827, "lng": -123.1207},
]
categories = ["high", "medium", "low", "special"]
data_points = []
for city in cities:
data_point = {**city, "value": random.randint(10, 100), "category": random.choice(categories)}
data_points.append(data_point)
return data_points
We then define the HTML content for the report:
def get_html_content():
    data_points = generate_globe_data()

    html_content = f"""
    <!DOCTYPE html>
    <html lang="en">
    ...
    </html>
    return html_content
"""
(We exclude it here due to length. You can find it in the source file).
Finally, we run the workflow:
if __name__ == "__main__":
    flyte.init_from_config()
    r = flyte.run(generate_globe_visualization)
    print(r.name)
    print(r.url)
    r.wait()
When the workflow runs, the report will be visible in the UI:
Streaming example
Above we demonstrated reports that are sent to the UI once, at the end of the task execution. But, you can also stream updates to the report during task execution and see the display update in real-time.
You do this by calling flyte.report.flush() (or specifying do_flush=True in flyte.report.log()) periodically during the task execution, instead of just at the end of the task execution
In the above examples we explicitly call flyte.report.flush() to send the report to the UI.
In fact, this is optional since flush will be called automatically at the end of the task execution.
For streaming reports, on the other hand, calling flush() periodically (or specifying do_flush=True
in flyte.report.log()) is necessary to display the updates.
First we import the necessary modules, and set up the task environment:
import asyncio
import json
import math
import random
import time
from datetime import datetime
from typing import List

import flyte
import flyte.report

env = flyte.TaskEnvironment(name="streaming_reports")
Next we define the HTML content for the report:
DATA_PROCESSING_DASHBOARD_HTML = """
...
"""
(We exclude it here due to length. You can find it in the source file).
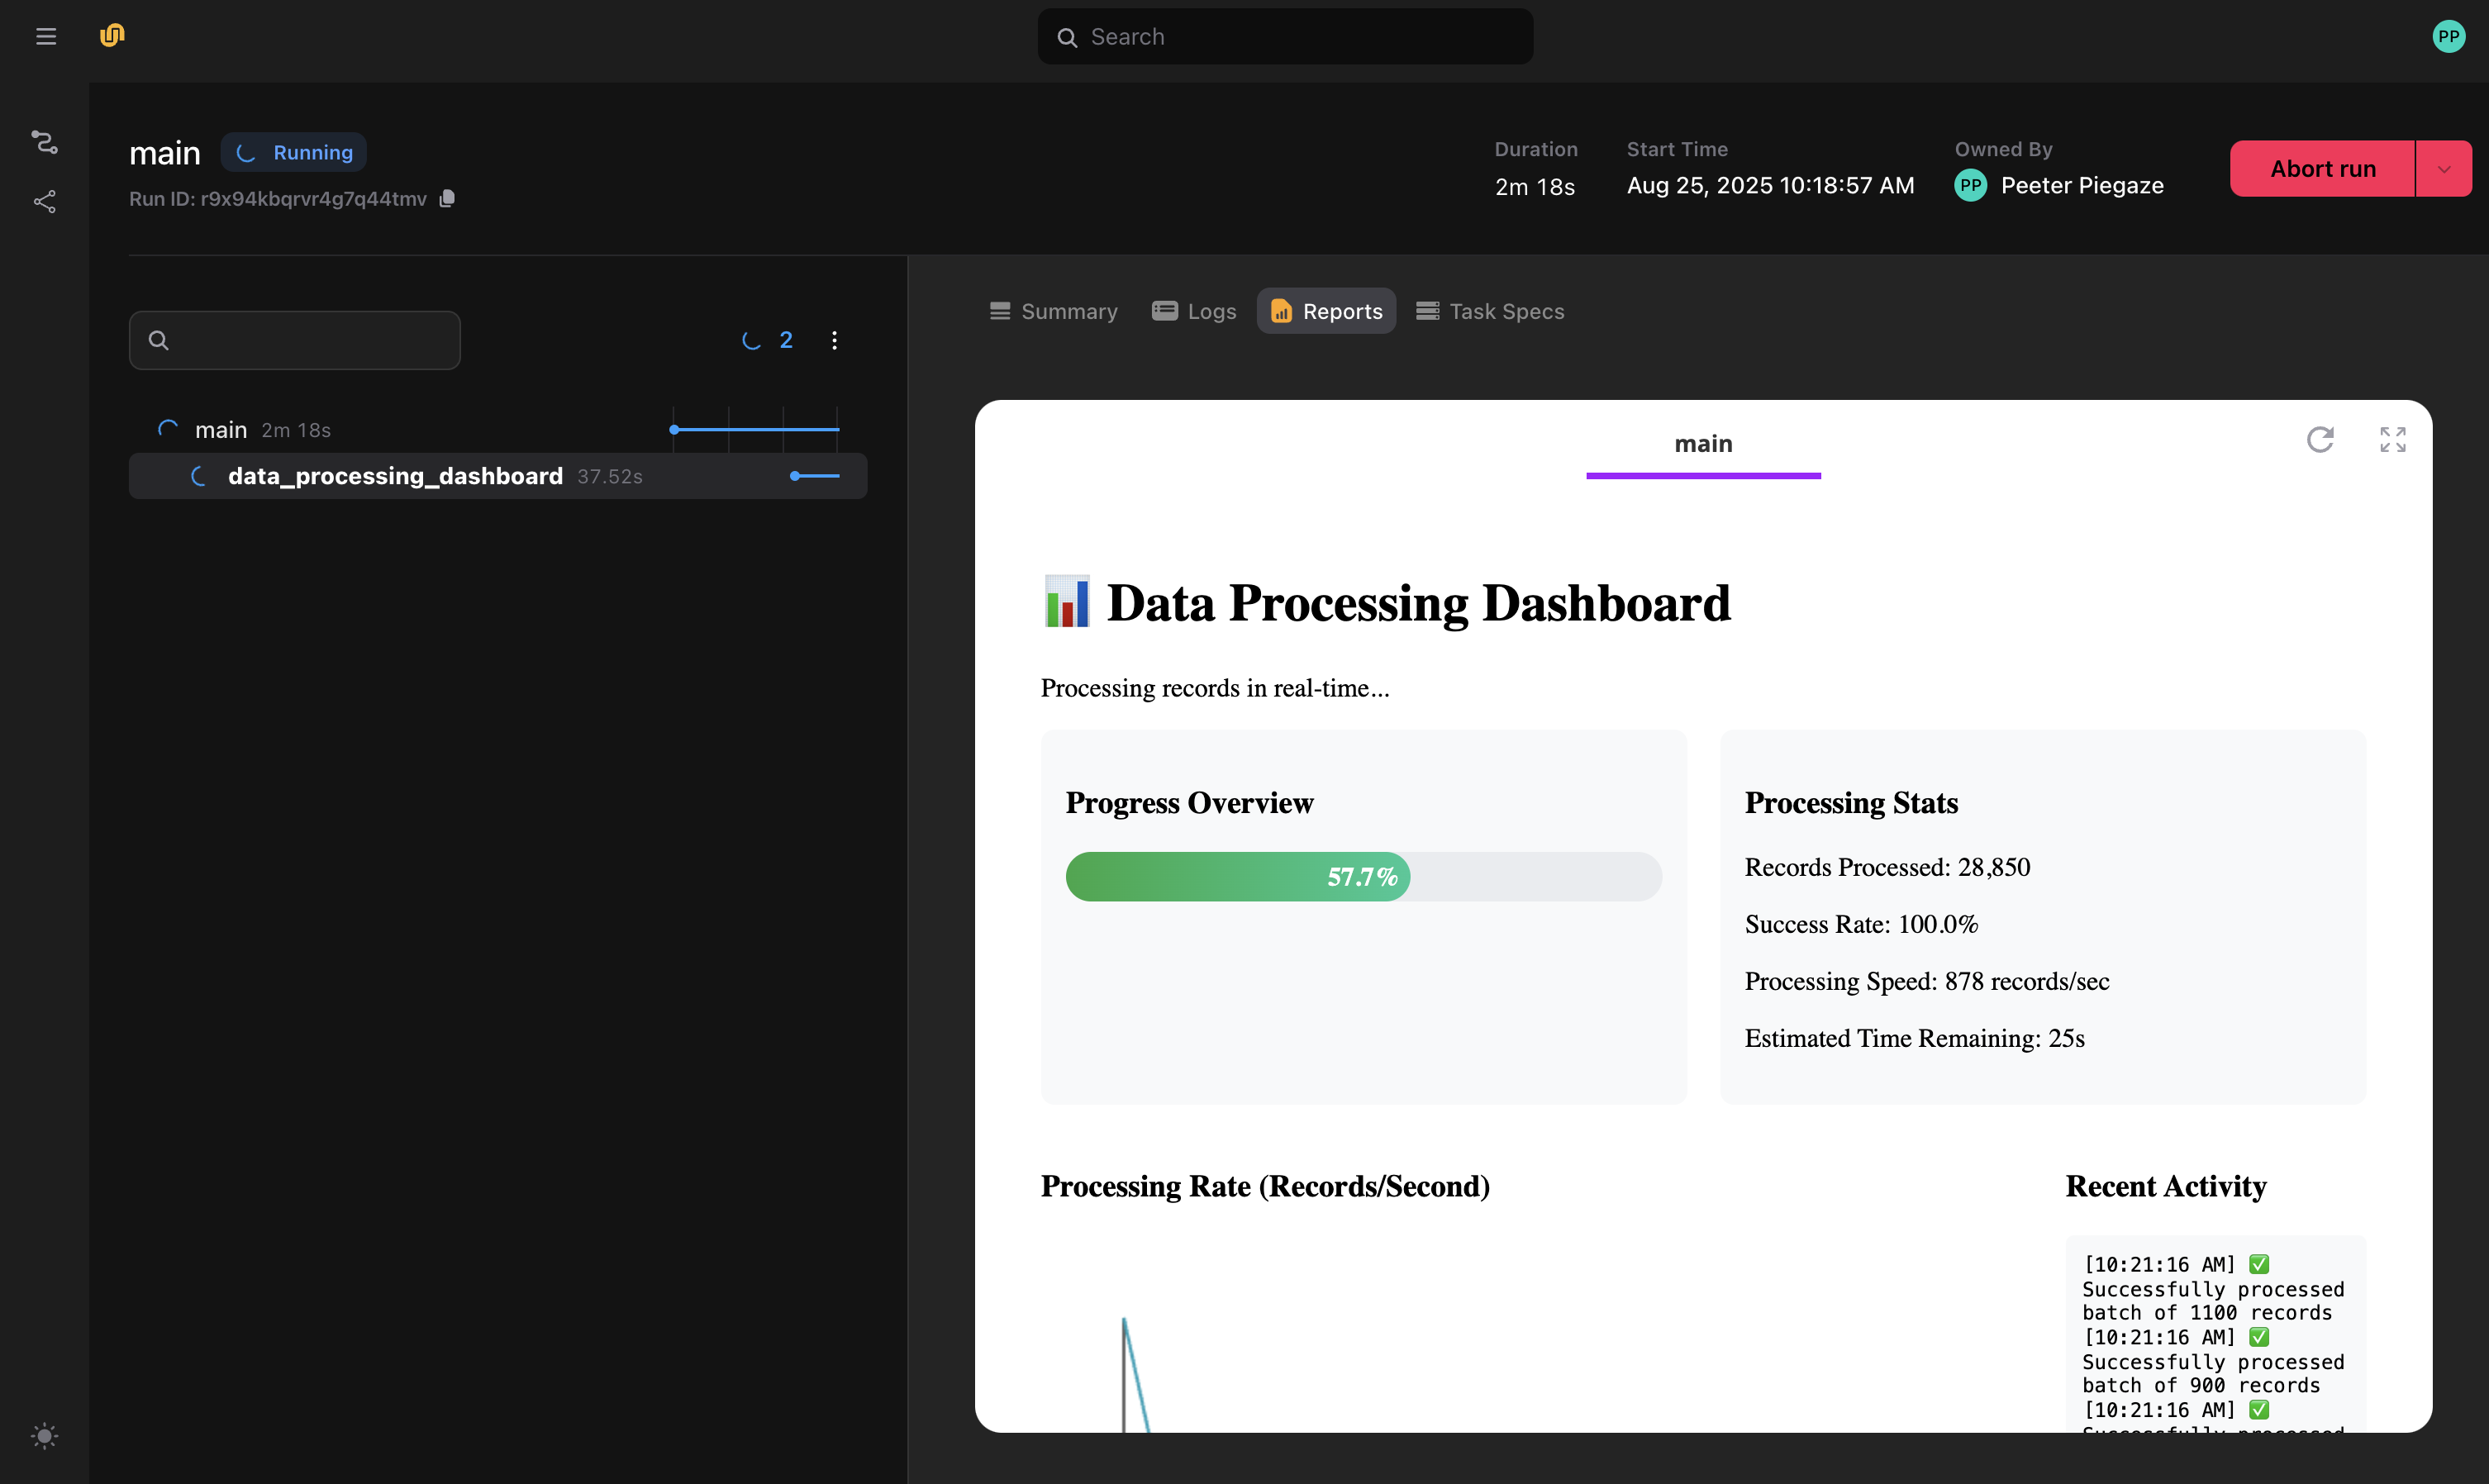
Finally, we define the task that renders the report (data_processing_dashboard), the driver task of the workflow (main), and the run logic:
@env.task(report=True)
async def data_processing_dashboard(total_records: int = 50000) -> str:
    """
    Simulates a data processing pipeline with real-time progress visualization.
    Updates every second for approximately 1 minute.
    """
    await flyte.report.log.aio(DATA_PROCESSING_DASHBOARD_HTML, do_flush=True)

    # Simulate data processing
    processed = 0
    errors = 0
    batch_sizes = [800, 850, 900, 950, 1000, 1050, 1100]  # Variable processing rates

    start_time = time.time()

    while processed < total_records:
        # Simulate variable processing speed
        batch_size = random.choice(batch_sizes)

        # Add some processing delays occasionally
        if random.random() < 0.1:  # 10% chance of slower batch
            batch_size = int(batch_size * 0.6)
            await flyte.report.log.aio("""
            <script>addActivity("⚠️ Detected slow processing batch, optimizing...");</script>
            """, do_flush=True)
        elif random.random() < 0.05:  # 5% chance of error
            errors += random.randint(1, 5)
            await flyte.report.log.aio("""
            <script>addActivity("❌ Processing errors detected, retrying failed records...");</script>
            """, do_flush=True)
        else:
            await flyte.report.log.aio(f"""
            <script>addActivity("✅ Successfully processed batch of {batch_size} records");</script>
            """, do_flush=True)

        processed = min(processed + batch_size, total_records)
        current_time = time.time()
        elapsed = current_time - start_time
        rate = int(batch_size) if elapsed < 1 else int(processed / elapsed)
        success_rate = ((processed - errors) / processed) * 100 if processed > 0 else 100

        # Update dashboard
        await flyte.report.log.aio(f"""
        <script>
            updateDashboard({processed}, {total_records}, {rate}, {success_rate});
        </script>
        """, do_flush=True)

        print(f"Processed {processed:,} records, Errors: {errors}, Rate: {rate:,}"
              f" records/sec, Success Rate: {success_rate:.2f}%", flush=True)
        await asyncio.sleep(1)  # Update every second

        if processed >= total_records:
            break

    # Final completion message
    total_time = time.time() - start_time
    avg_rate = int(total_records / total_time)

    await flyte.report.log.aio(f"""
    <script>addActivity("🎉 Processing completed successfully!");</script>
    <div style="background-color: #d4edda; border: 1px solid #c3e6cb; color: #155724; padding: 20px; border-radius: 8px; margin-top: 20px;">
        <h3>🎉 Processing Complete!</h3>
        <ul>
            <li><strong>Total Records:</strong> {total_records:,}</li>
            <li><strong>Processing Time:</strong> {total_time:.1f} seconds</li>
            <li><strong>Average Rate:</strong> {avg_rate:,} records/second</li>
            <li><strong>Success Rate:</strong> {success_rate:.2f}%</li>
            <li><strong>Errors Handled:</strong> {errors}</li>
        </ul>
    </div>
    """, do_flush=True)
    print(f"Data processing completed: {processed:,} records processed with {errors} errors.", flush=True)

    return f"Processed {total_records:,} records successfully"


@env.task
async def main():
    """
    Main task to run both reports.
    """
    await data_processing_dashboard(total_records=50000)


if __name__ == "__main__":
    flyte.init_from_config()
    r = flyte.run(main)
    print(r.name)
    print(r.url)
    r.wait()
The key to the live update ability is the while loop that appends Javascript to the report. The Javascript calls execute on append to the document and update it.
When the workflow runs, you can see the report updating in real-time in the UI: